ATS - Software
The system operates on the principal that the speed of sound in a gas is proportional to the temperature of that gas.
Ideal Gas Law.
ATS-Software presents powerful visual information on real time or historical gas temperatures for temperature distribution within a furnace or combustion process. Spatial temperature distribution profiles, individual path temperatures, temperature trends, and average gas temperatures within user-defined areas are all quickly and easily available.
Like all of our software is menu driven for ease of use. In addition, it has soft key buttons to quickly move between screens, or to open and close screens. ATS-Software automatically adjusts the screens to fit each screen side by side to fill the window you determine.

Isothermal Map

Isothermal Map
ATS-Software provides an accurate and clear picture of this temperature distribution profile... in real time.
The Isothermal Map Screen presents spatial temperature information as a series of isothermal lines and is color-coded. In addition, a digital readout of the temperature at any point on the map is obtained by simply moving the mouse cursor over the map display.
In History mode, ATS-Software will give you the option to recall data from an earlier time.
Area Map

Area Map
ATS-Software can compute and display the average gas temperature within user-defined areas (or zones) of the mapping plane. Up to twenty-four (24) zones within the plane may be defined by the user.
The system will then calculate and graphically display the average temperature within each of these zones. The Area Plot windows could be circular and rectangular. Area plots are especially useful for plant control systems such as a DCS
Noise / Leak Detection
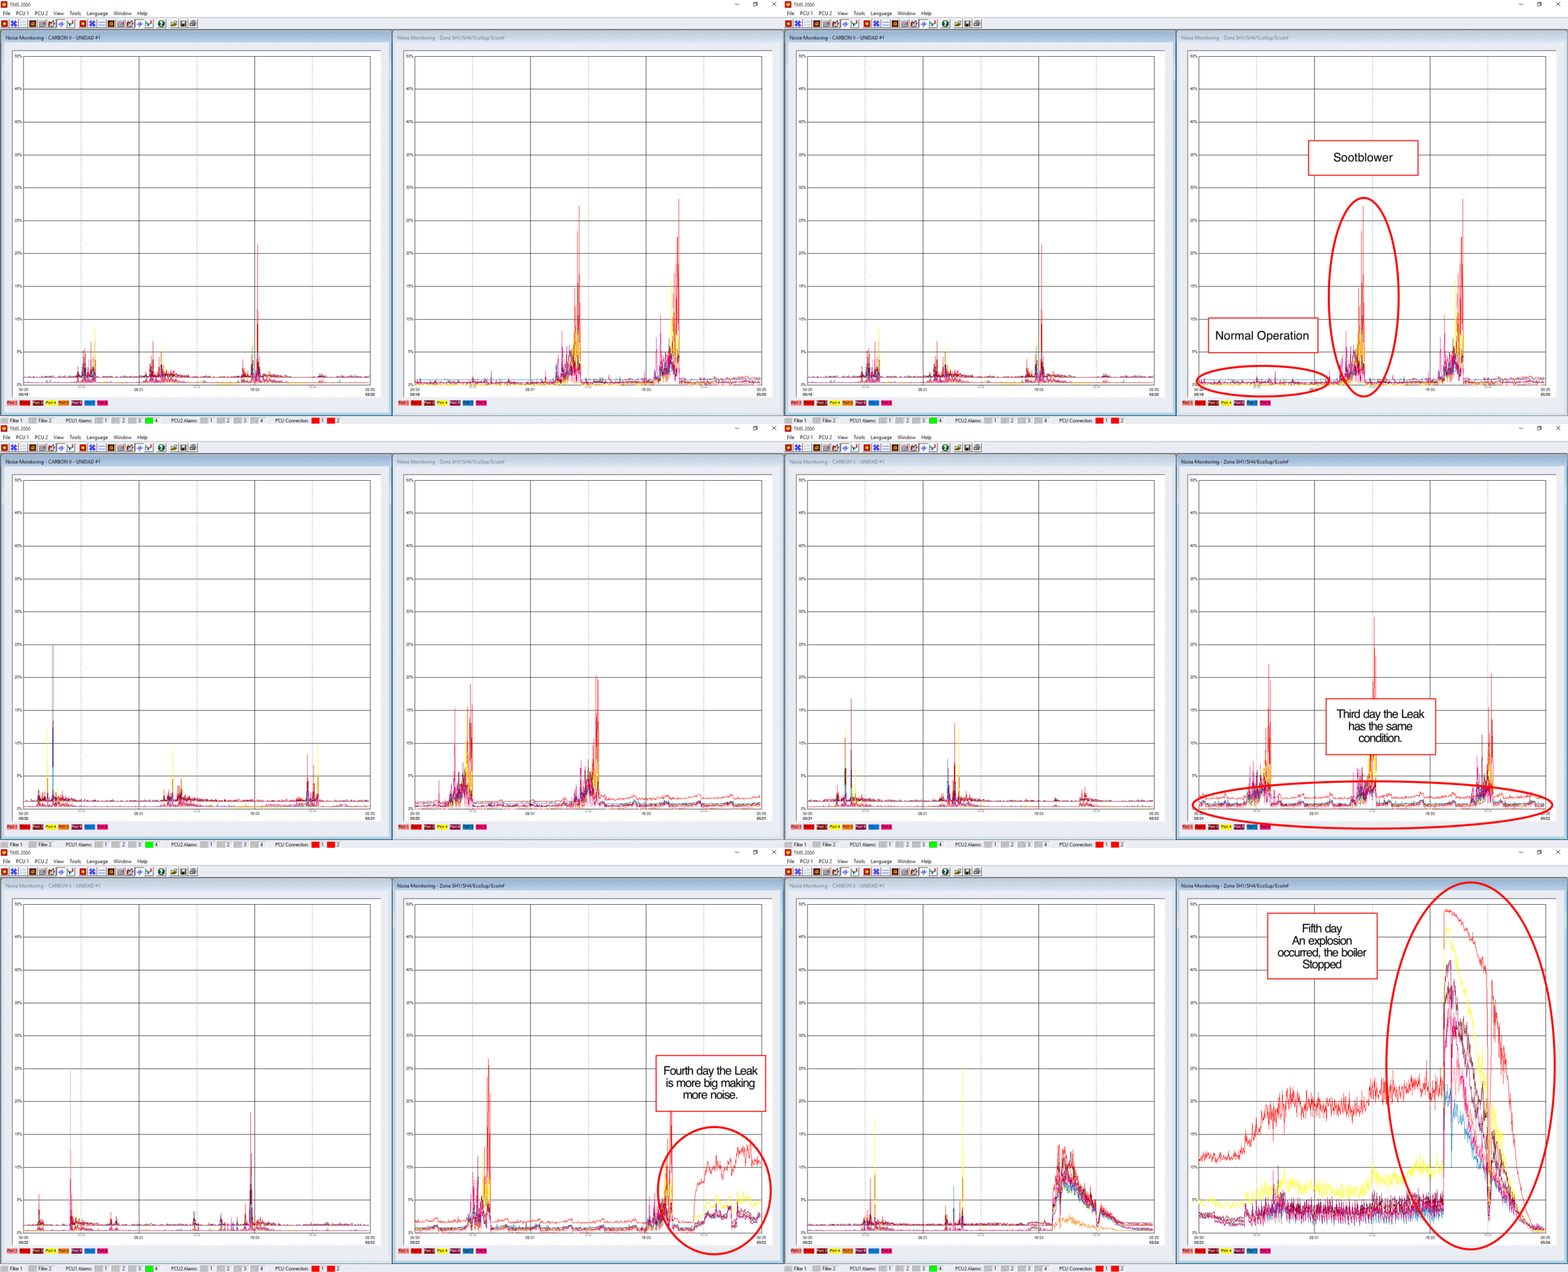
The ATS-Software presents a system for the detection of noise in the combustion zone of the furnace or boiler.
The microphone that is located in the waveguide can hear the normal noise of the boiler / furnace continuously and displays a graphical trend for 24 hours a day, 365 days a year.


© 2023 SEI Europe Technologie SRL